System Overview
Situational awareness in the immediate aftermath of a disastrous earthquake is of fundamental importance for an effective societal response. While overall disaster management is critical, a successful, organized response is dependent on the collective efforts of the community at large. When a potentially damaging earthquake occurs, businesses, utility and other lifeline managers, emergency responders, and others have an urgent need for information about the impact on their own facilities so they can make informed decisions and take quick actions to ensure safety, restore system functionality, and minimize losses.
The U.S. Geological Survey’s (USGS) ShakeMap (Wald et al., 1996b, 2005) is now a widely known and available tool used to portray the extent and severity of ground shaking following an earthquake. Although ShakeMap was initially designed to be primarily a Web-based real-time display, ShakeMap products have evolved to include high-resolution graphics files, maps made specifically for television, GIS files for direct input into the FEMA’s HAZUS (NIBS and FEMA, 2003) loss estimation software, as well as gridded extensible markup language (XML) and Google Earth (KML) data files, all of which are now also automatically generated. ShakeMaps can be used for a wide range of needs, including emergency response, loss estimation, scientific and engineering analyses, and public information. However, the full potential of ShakeMap is only beginning to be realized.
For example, Ranf et al. (2007) found that using shaking parameters provided by ShakeMap for the 2001, Nisqually, Washington (M6.7) earthquake would have been highly useful in prioritizing post-earthquake response and inspection. By modifying existing HAZUS (NIBS and FEMA, 2003) fragility curves to accommodate the older, particularly vulnerable bridges in the region that dominated bridge damage, and by focusing on 0.3 sec period spectral acceleration, they noted that their prioritization strategy would have made it possible to identify 80% of the moderately damaged bridges by inspecting only 14% of the 3,407 bridges within the boundaries of the ShakeMap. Hence, despite the popularity and acclaim of ShakeMap for emergency response and post-earthquake information, and the proven potential for facilitating prioritization of response efforts, there is still a lack of implementation of tools that take advantage of the full potential of ShakeMap for post-earthquake assessments (as well as for planning exercises). Critical users need to move beyond simply looking at ShakeMap, and begin implementing response protocols that utilize the known shaking distribution in fully automated systems in order to fully realize this potential in order to prioritize and coordinate response efforts. To this end the USGS has developed ShakeCast.
ShakeCast (http://earthquake.usgs.gov/shakecast), short for ShakeMap Broadcast, is a fully automated, open-source system for delivering specific ShakeMap products to critical users and for triggering established post-earthquake response protocols. ShakeCast allows utilities, transportation agencies, and other large organizations to automatically determine the shaking value at their facilities, set thresholds for notification of damage states (typically green, yellow, and red) for each facility and then automatically notify (via pager, cell phone, or email) specified operators, inspectors, and others within their organizations responsible for those particular facilities in order to prioritize inspection and response. A schematic diagram showing the ShakeMap/ShakeCast flow of data and information is shown in Figure 1.
Figure 1 ShakeCast flow chart indicating flow of USGS ShakeMap data, users' ShakeCast inventory and user databases, and notifications.
As an example, the California Department of Transportation (Caltrans) is operating the ShakeCast system and is responsible for tens of thousands of California bridges and overpasses. Having a near-instantaneous estimate of the potential damage to each bridge is fundamental for enabling them to prioritize rerouting traffic, closures, and inspections following a significant earthquake. In general, businesses, utilities, and agencies could develop their own strategies and tools for the utilization of ShakeMap given their unique facilities and communication paths. However, such efforts can be costly and complex. The USGS is facilitating this process with the development of ShakeCast, by building a more general use tool that accomplishes most of the critical user needs. As a critical user, Caltrans has been instrumental in providing the resources and the motivation to further enhance the ShakeCast system, allowing USGS to progress from a prototype system (Version 1.0, Wald et al., 2003) to a fully functional system described herein (Version 2.0).
Service Model
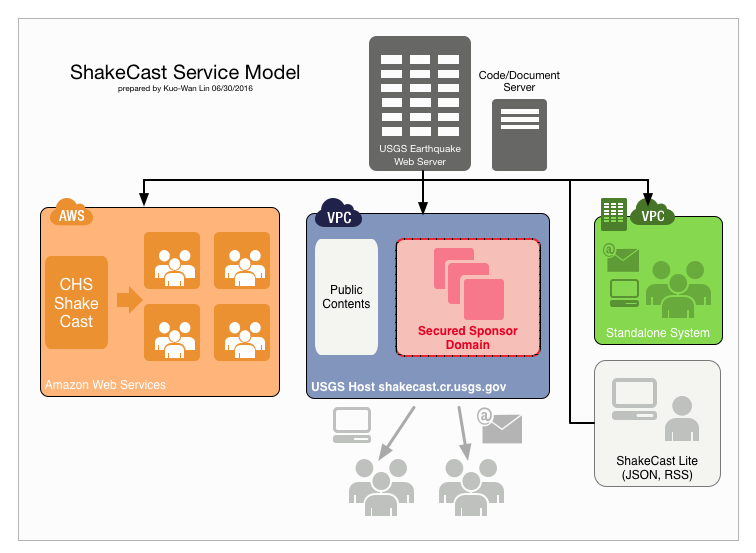
ShakeCast comes in two distinctly different applications, Standalone ShakeCast and ShakeCast Lite. ShakeCast Cloud is an application hosting service for the full ShakeCast system by the Amazon Web Services. A comparison of three service models is shown below.
 .
.
Who should use ShakeCast
Businesses, utility and other lifeline managers, emergency responders, and others have an urgent need for information about the impact on their own facilities so they can make informed decisions and take quick actions to ensure safety, restore system functionality, and minimize losses.
Who should probably not use ShakeCast
Individual users without a significant number of facilities and knowledge of their inventory. ShakeCast requires significant commitment of time and both IT and earthquake engineering expertise.
[]:


