Note
Go to the end to download the full example code.
Plotting Cross Sections
import numpy as np
import matplotlib.pyplot as plt
from os.path import join
import gspy
from gspy import Survey
from pprint import pprint
First Create the Survey & Data Objects
# Initialize the Survey
survey = gspy.open_datatree("..//data_files//tempest_aseg//Tempest.nc")['survey']
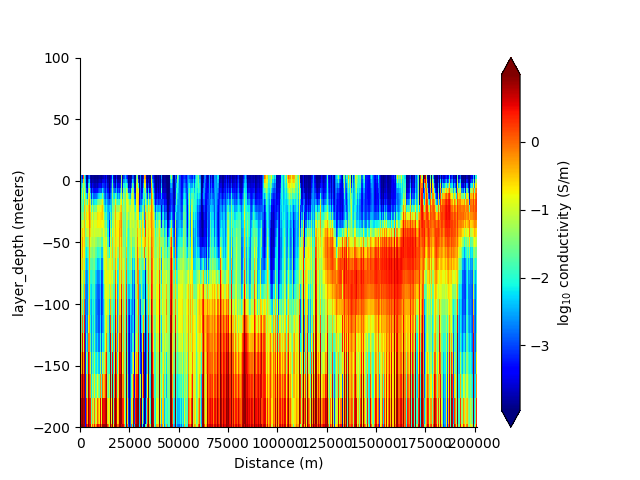
plt.figure()
survey['models/inverted_models'].gs.plot_cross_section(line_number=225401.,
                                                        variable='conductivity',
                                                        hang_from=None,
                                                        axis='distance',
                                                        equalize=True,
                                                        log=10,
                                                        cmap='jet',
                                                        ylim=[-200, 10.0])
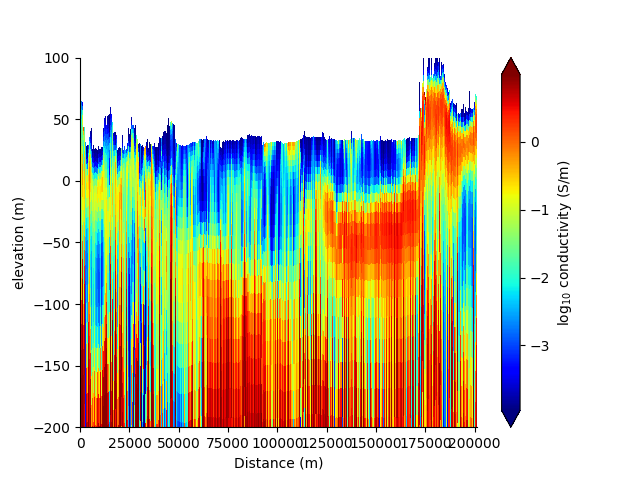
plt.figure()
survey['models/inverted_models'].gs.plot_cross_section(line_number=225401.,
                                                       variable='conductivity',
                                                       hang_from='elevation',
                                                       axis='distance',
                                                       equalize=True,
                                                       log=10,
                                                       cmap='jet',
                                                       ylim=[-450, 150.0])
plt.show()
Total running time of the script: (0 minutes 1.932 seconds)