Note
Click here to download the full example code
Multiple TIFs to NetCDF conversion
Dataset References: Minsley, B.J., James, S.R., Bedrosian, P.A., Pace, M.D., Hoogenboom, B.E., and Burton, B.L., 2021, Airborne electromagnetic, magnetic, and radiometric survey of the Mississippi Alluvial Plain, November 2019 - March 2020: U.S. Geological Survey data release, https://doi.org/10.5066/P9E44CTQ. James, S.R., and Minsley, B.J., 2021, Combined results and derivative products of hydrogeologic structure and properties from airborne electromagnetic surveys in the Mississippi Alluvial Plain: U.S. Geological Survey data release, https://doi.org/10.5066/P9382RCI.
import matplotlib.pyplot as plt
from os.path import join
from gspy import Survey
from pprint import pprint
Convert the TIFs data to netcdf
data_path = "..//..//supplemental//region//MAP"

# Define ..//supplemental information file
..//supplemental = join(data_path, "data//Tempest_survey_md.json")

# Add ..//supplemental information to the survey
survey = Survey(..//supplemental)

# Define input TIF-format data file and associated variable mapping file
d_grid_supp = join(data_path, 'data//Tempest_rasters_md.json')

# Read data and format as Griddata class object
survey.add_raster(metadata_file=d_grid_supp)

# Write NetCDF
d_out = join(data_path, 'data//tifs.nc')
survey.write_netcdf(d_out)
Read in the netcdf files
new_survey = Survey.read_netcdf(d_out)
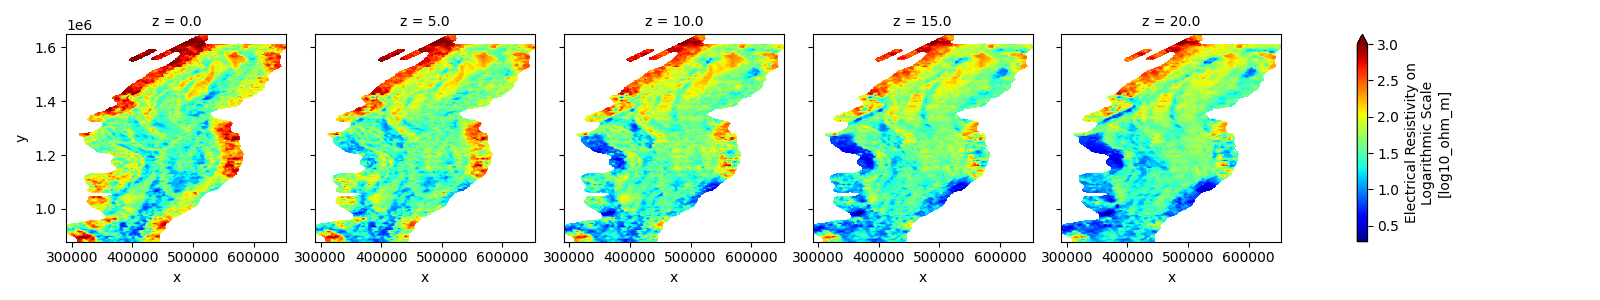
Plotting
new_survey.raster['resistivity'].plot(col='z', vmax=3, cmap='jet')
plt.show()
Total running time of the script: ( 0 minutes 1.212 seconds)